Transform Dynamics GP Data into Actionable Intelligence with Power BI
Creating actionable intelligence from your Dynamics GP data can be accomplished with the robust features and functionalities in Power BI.
In business, data is the lifeblood of any organization that fuels informed decision-making and propels growth. However, harnessing its power requires more than acquiring some numbers and putting them into a spreadsheet. Organizations must take a strategic approach to capture, model, and analyze the data effectively to plan two steps ahead when planning for the future.
In this blog, we will dive into how you can use your Dynamics GP data to create actionable intelligence through the data visualization capabilities in Power BI.
First, let’s answer a key question:
What is Actionable Intelligence?
Actionable intelligence is information or data available at your fingertips you can use to guide your decision-making during an evolving situation or even forecast the future. A simple but effective example is something we see at the grocery store every year when the seasons change. Based on buyer behaviors and data compiled about shopping habits, stores know to put items like corn, BBQ materials, sunscreen, and cold beverages in high-traffic areas during the summer months. Conversely, they might put warm clothing, hot beverages, and holiday-themed items in those areas during the winter months.
By turning your data into actionable intelligence, you can capture meaningful insights into how your business is performing, areas of strength, and places where you can improve. All of this combines to guide your decision-making now and in the future.
An easy way to do this is to take your ERP data – from Dynamics GP, as an example – and combine it with the strength of Power BI.
Establishing Actionable Intelligence: How to Get Your Dynamics GP Data into Power BI
While this might sound like a complicated process, it’s as simple as following these steps:
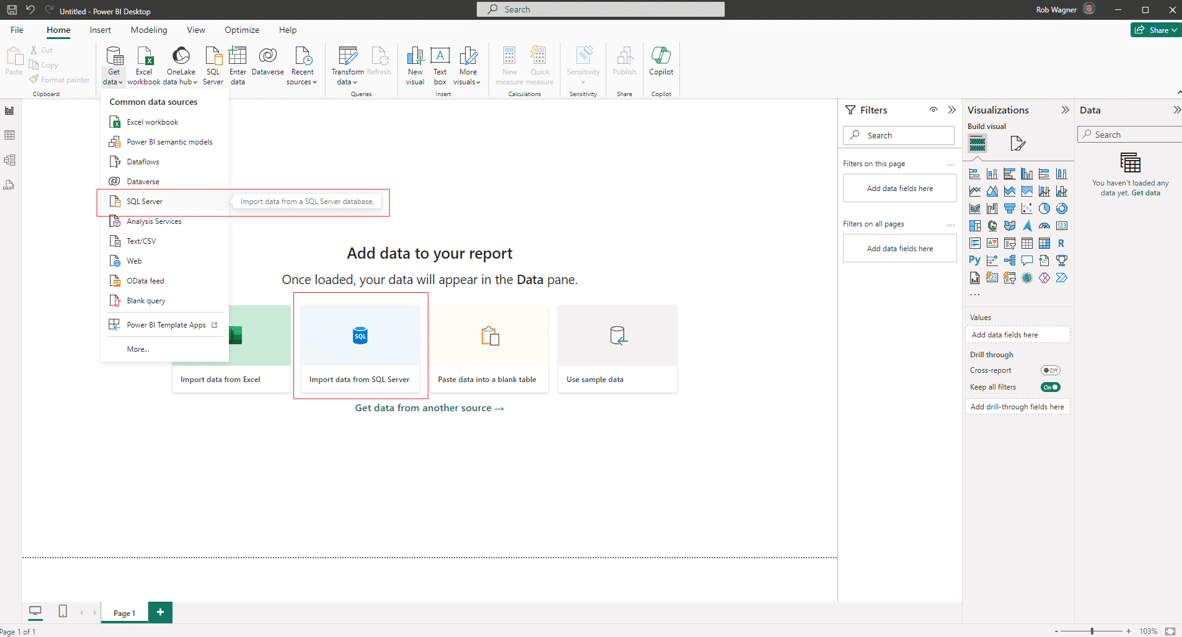
1. Open Power BI
Start with a clean slate and open a blank Power BI report.
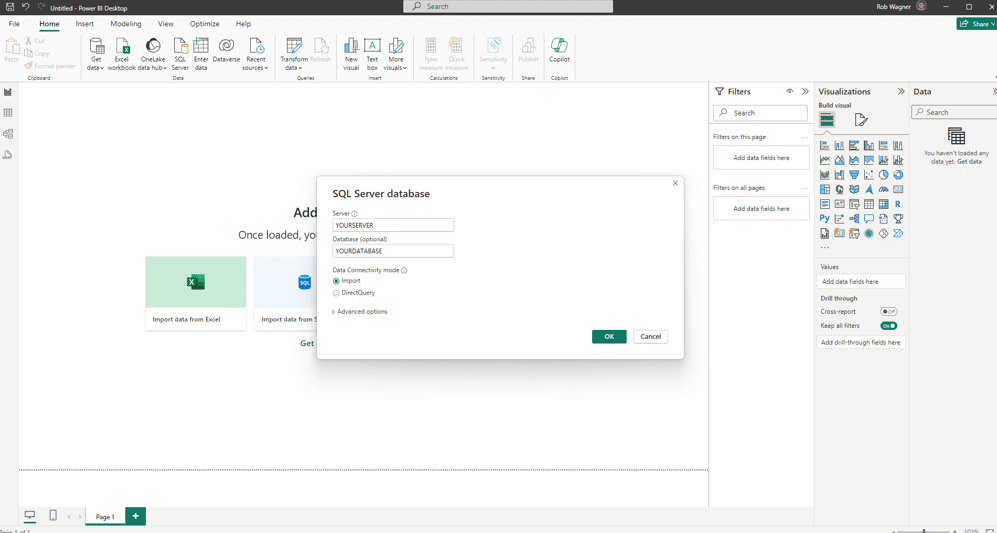
2. Pull in your Dynamics GP data from the SQL Server
Choose Get Data and then import data from SQL Server. Make sure you enter the SQL Server name and the database containing the data you want to pull in, then press OK.
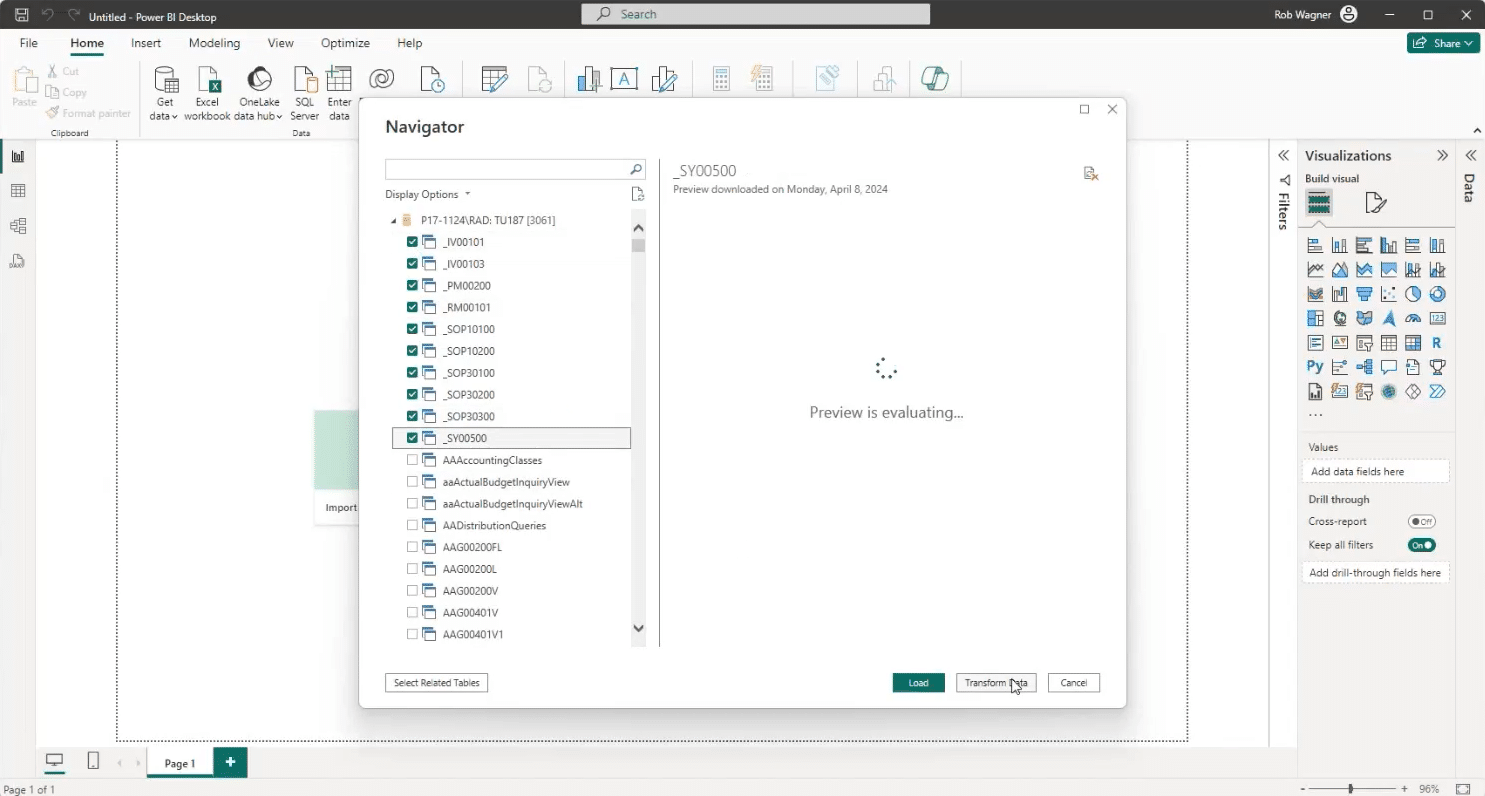
3. Find the data tables you want to use
Once you connect to the database, you will see a list of views and tables available. Select the ones you want to include in the Power BI report and then click “Transform data”. This will bring the data into the Power Query editor where you can rename or amend your datasets to make them more user-friendly.
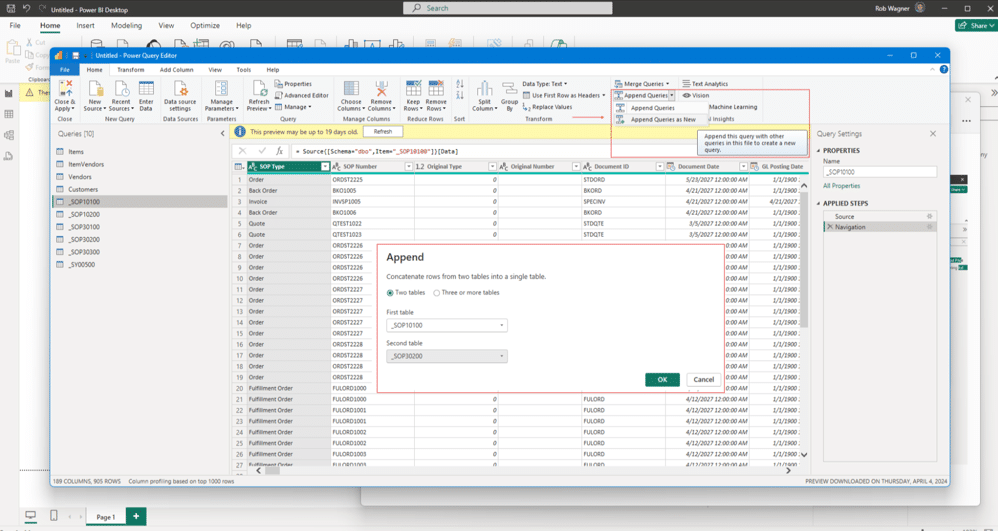
During this step, you can also create Append queries, also known as views between two tables inside the Power Query editor. Doing this creates a friendly-named combination of tables for the model user to draw from. You can then hide base tables from the user to avoid the unfriendly named components. This process ensures that users creating a Power BI report only see the easily identifiable and relevant information they need for their jobs.
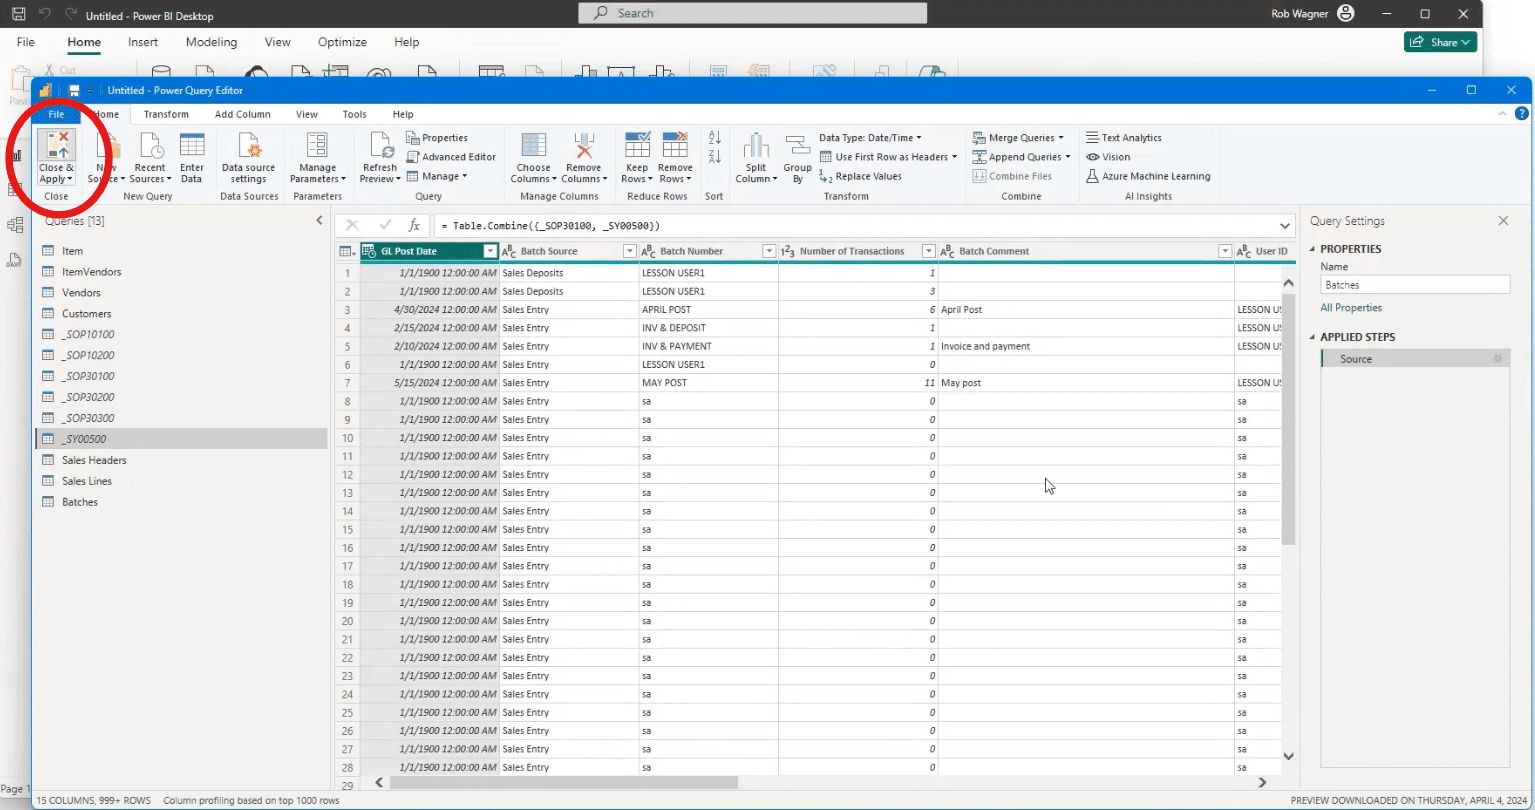
4. Click “Close and Apply” to bring the data into Power BI
After the system completes the upload, you can move on to the next step.
The Three Ms of Creating Actionable Intelligence with Power BI: Modelling, Munging, and Making
Now that your Dynamics GP data has been uploaded into Power BI, it’s time to transform the shape of your model. You can do this by following the three Ms, modeling and munging. Let’s dive into how each one functions in helping you create your report.
Modeling with Munging Your Data
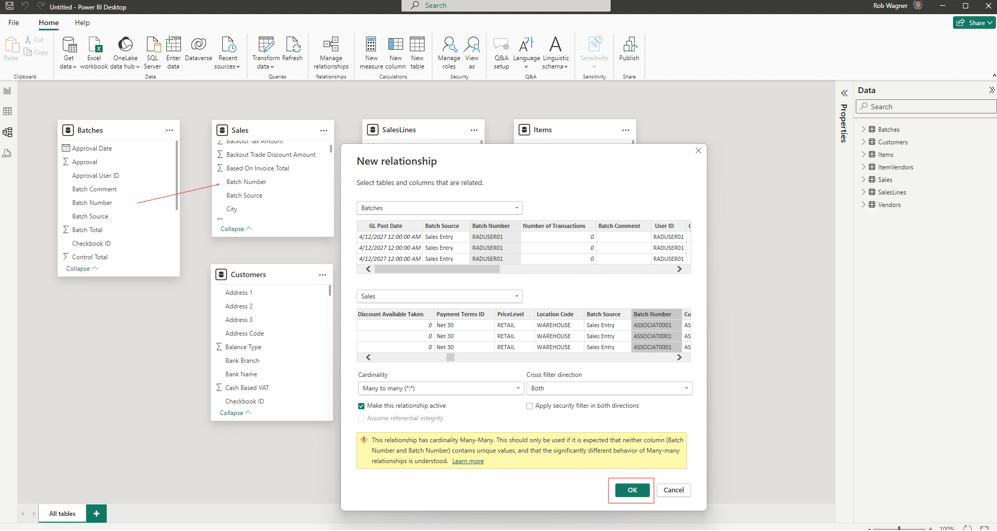
The first step is to munge your data together. This is simply the process of creating relationships between the tables and datasets. You can do this in Power BI by matching table names through a user-friendly drag-and-drop feature. Once you have munged the data, you have a simple ready-to-use model. Note: Further transformation is done with Excel-like functions inside Power Query.
A new window will open when you create a relationship. You can use the defaults and click “OK.”
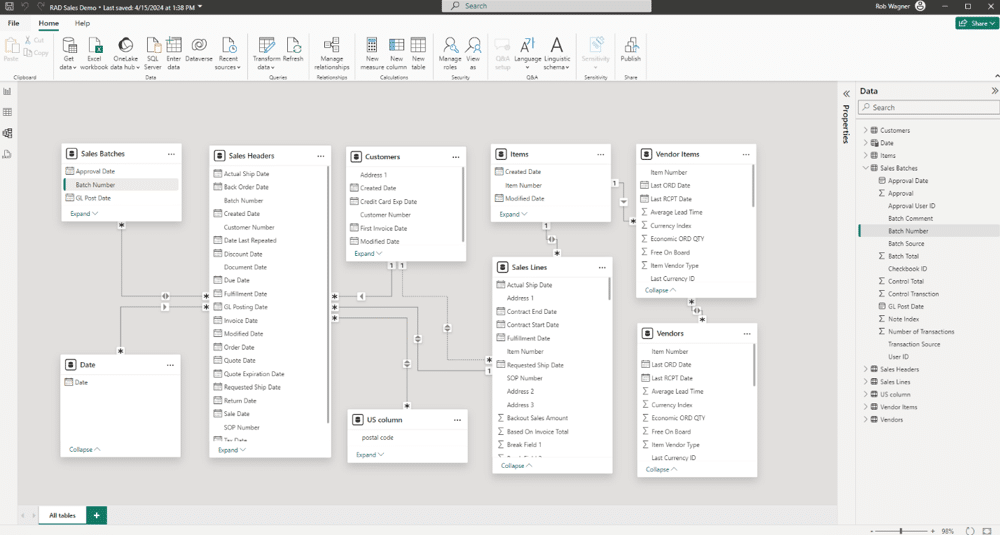
Once you’ve created your relationships and munged the tables to produce your model, it’s time to make your visuals and presentations. You can do this by co-mingling the data with charts and dropping the field into the “well.” Note that “well” is a term applied to whatever visual you selected. Just as you’d lower a bucket into a well to retrieve water, you “lower” your fields into the well to retrieve insights from your data.
Making Your Power BI Dashboard
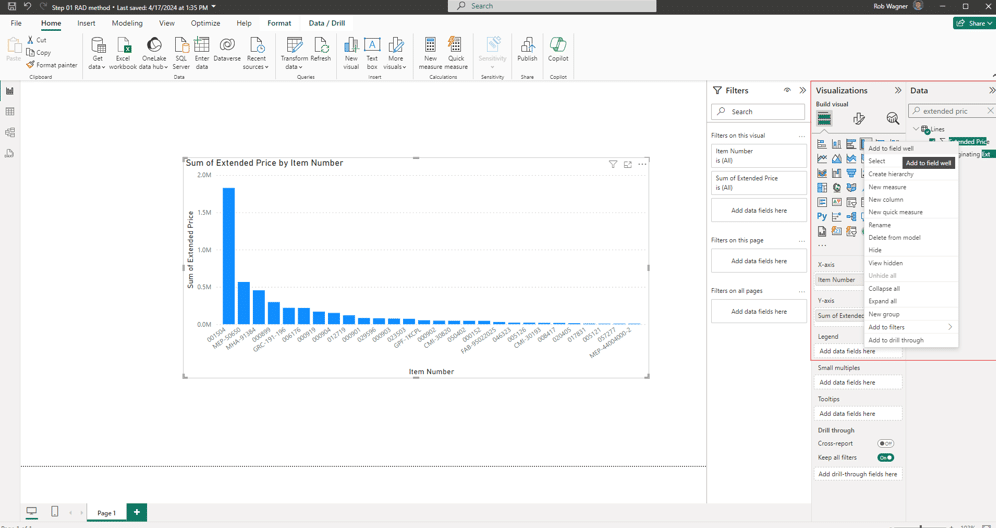
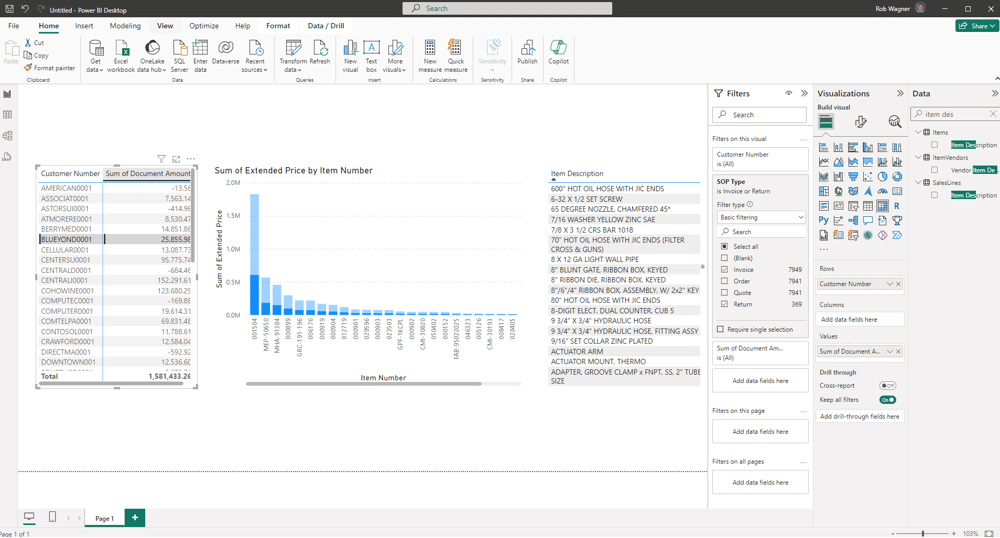
If you go back into your report, you can select visuals from the panel on the right-hand side of your screen. For this example, we’ve chosen a column chart. If you go further right, you will find your data tables and add them to the visual.
You’re not limited to a single visual per report. You can add other visuals that display different data and then drag and drop or size them to fit your needs. You can also apply your branding elements like colors logos, and more. When you make your report, you will pull from the Model that has tables munged during the transformation process.
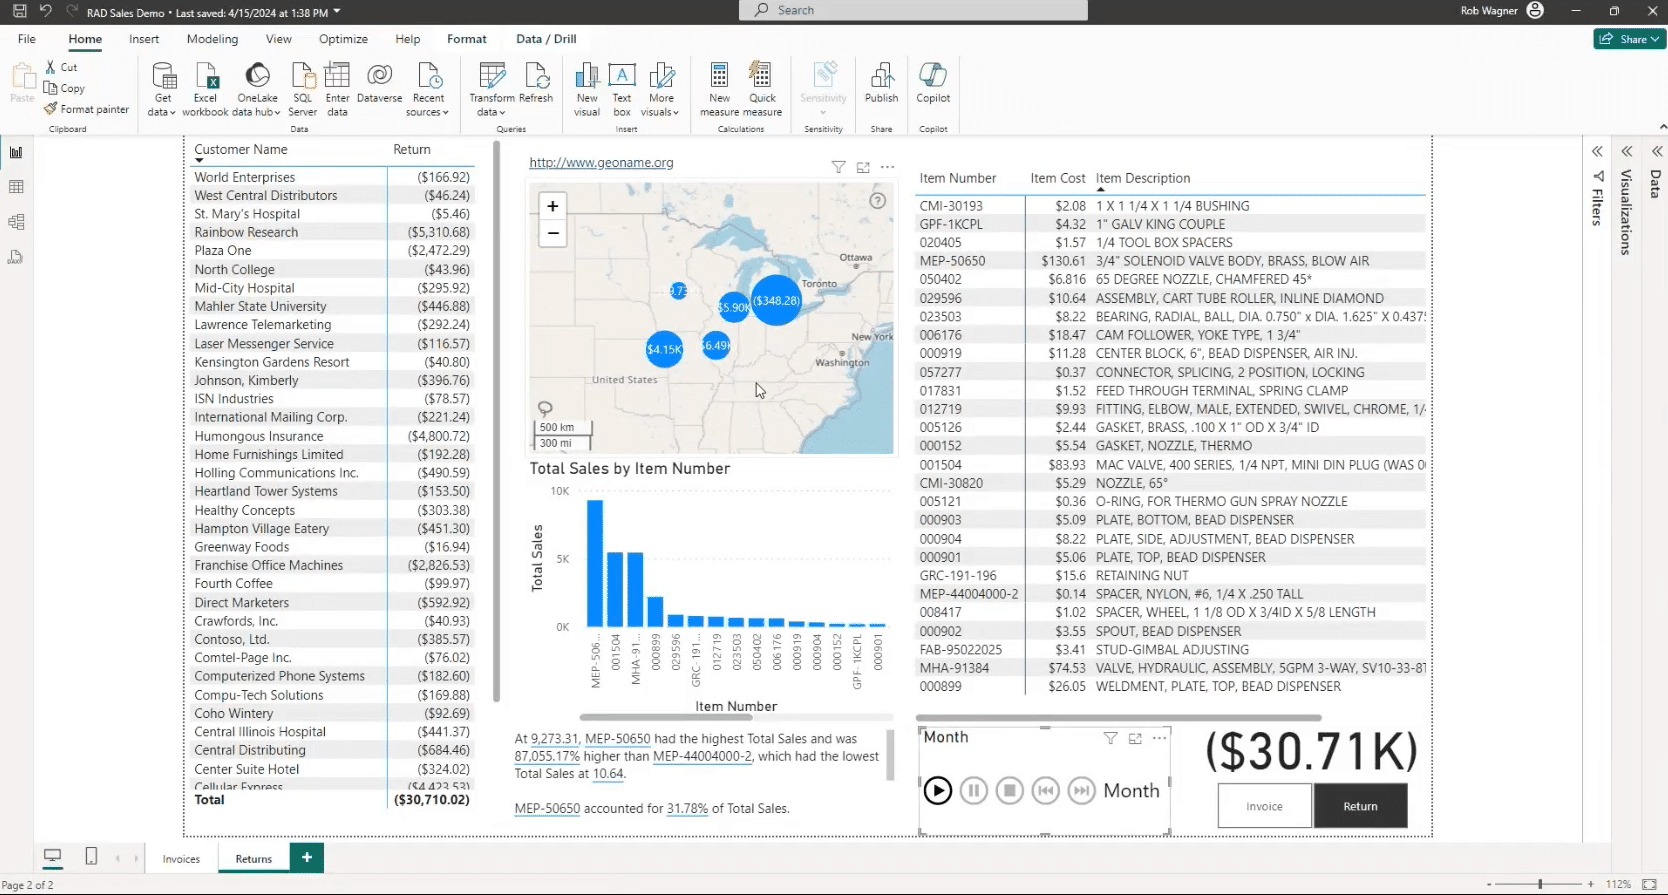
You can also customize the reports to make them interactive. In the example below you can click on the geographical regions in the map and see different sales numbers for each region in the same view. You can do the same with months, weeks, or years if you are trying to show revenue growth.
There are many ways you can customize the report to make it interactive.
Here is your finished product:
Want to Learn More About What Power BI Can Do for You?
Reach out to Stoneridge Software! Whether you are operating a legacy system like Dynamics GP or something cloud-based in Dynamics 365, Power BI can help you easily compile and display your data so you can use it to create actionable intelligence to drive informed decision-making.
Under the terms of this license, you are authorized to share and redistribute the content across various mediums, subject to adherence to the specified conditions: you must provide proper attribution to Stoneridge as the original creator in a manner that does not imply their endorsement of your use, the material is to be utilized solely for non-commercial purposes, and alterations, modifications, or derivative works based on the original material are strictly prohibited.
Responsibility rests with the licensee to ensure that their use of the material does not violate any other rights.